IVRE
So I recently needed/wanted to have a closer look at a few thousand hosts. After identifying and listing all addresses I started doing my homework by running NMAP. I then ended up with far to many results to work with by hand. Having already read about Ivre I decided to give it a quick spin. I then made the mistake to post a Tweet about having used it and promising a quick write-up. Well, here it is!
What is IVRE?
Ivre is an open source reconnaissance framework offering a UI and CLI interface for tools like Bro, p0f, Nmap and MASSCAN. It’s written in Python and comes as a ready to install package or as a Vagrant script. It also includes a DokuWiki instance for documentation and notes.
As I’ve so far only used it for managing the results of Nmap portscans I can only cover this feature.
Setup
I tested all this on a clean Ubuntu 18.04 Server setup in VirtualBox. I only ran apt updateand apt upgrade after installation.
Vagrant & Docker
Following the instructions on the IVRE webpage is probably the quickest way to get a running instance.
Install Docker & Vagrant
Following the official Docker instructions
sudo apt-get install apt-transport-https ca-certificates curl software-properties-common
curl -fsSL https://download.docker.com/linux/ubuntu/gpg | sudo apt-key add -
sudo add-apt-repository "deb [arch=amd64] https://download.docker.com/linux/ubuntu $(lsb_release -cs) stable"

sudo apt update
sudo apt install docker-ce vagrant
Install Ivre
mkdir -m 1777 var_{lib,log}_{mongodb,neo4j} ivre-share
wget -q https://ivre.rocks/Vagrantfile
vagrant up --no-parallel

docker attach ivreclient
This will probably run into a Docker error message, due to your user not being in the docker group so run sudo usermod -aG docker karl where karl should be replaced with your username. You will then have to log out and back in.
You should now have a shell on the ivreclient.
IVRE
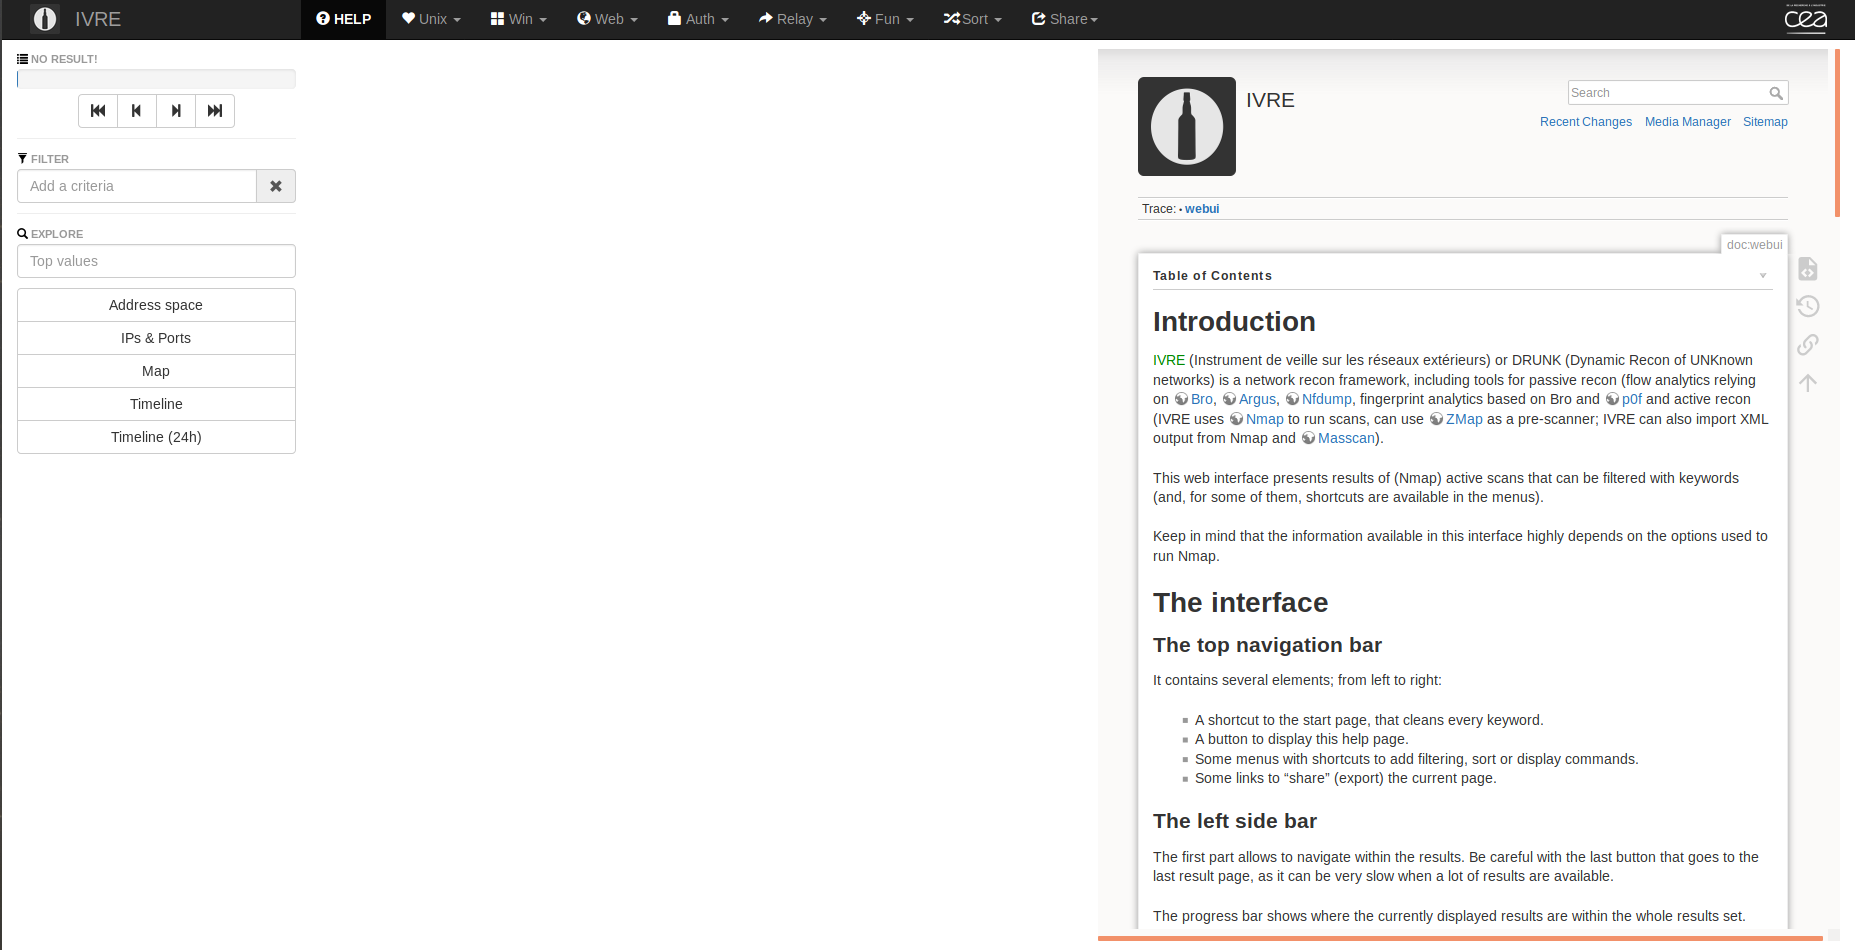
The IVRE Interface is split into four parts
- The main menu bar
- Filter \& Explore Column
- Column with the view of current results (10 results)
- Empty in the Screenshot
- And the “feature” column
- Contains the documentation in the screenshot
- Will show graphs, maps and other functionality
Scanning
There is a blogpost covering basic scanning which uses IVRE itself to perform the scans (which in return utilizes Nmap). On my first try it didn’t quite work as the commands i.e. runscans don’t exist, thus you have to run `ivre runscans’.
Importing data
As I run my scans from an existing box, I had to find a way to import plain Nmap scans. Luckily the example above actually utilizes Nmap and then makes you import the xml output. As such, I did exactly the same.
In your IVRE installation dir (where the vagrant file is) you created a folder called ivre-share, this folder is mounted in /ivre-share in the ivreclient docker and the quickest way to get data into the container.
After copying the files in there you can use the import tool to load the scans:
ivre nmap2db -r -s Scanner001 -c ROUTABLE /opt/scans/results/*
Which means
-ris recursive-s Scanner001is the name of the data source which will be shown in the webinterface-c ROUTABLEthe-coption lets you add the results to categories/opt/scans/results/*is the path to where my results are stored
To create the importable output I ran Nmap with the -oX parameter.
A note on the side: It will only import known results once. So if you accidentally don’t delete your old scans prior running the import, it will not ruin your database.
Using it!
I’ve currently got scans of about 6k hosts in my productive instance and it runs stable and quick. The things I’m showing here come from a test instance with only 8 hosts.
You will now see something like this
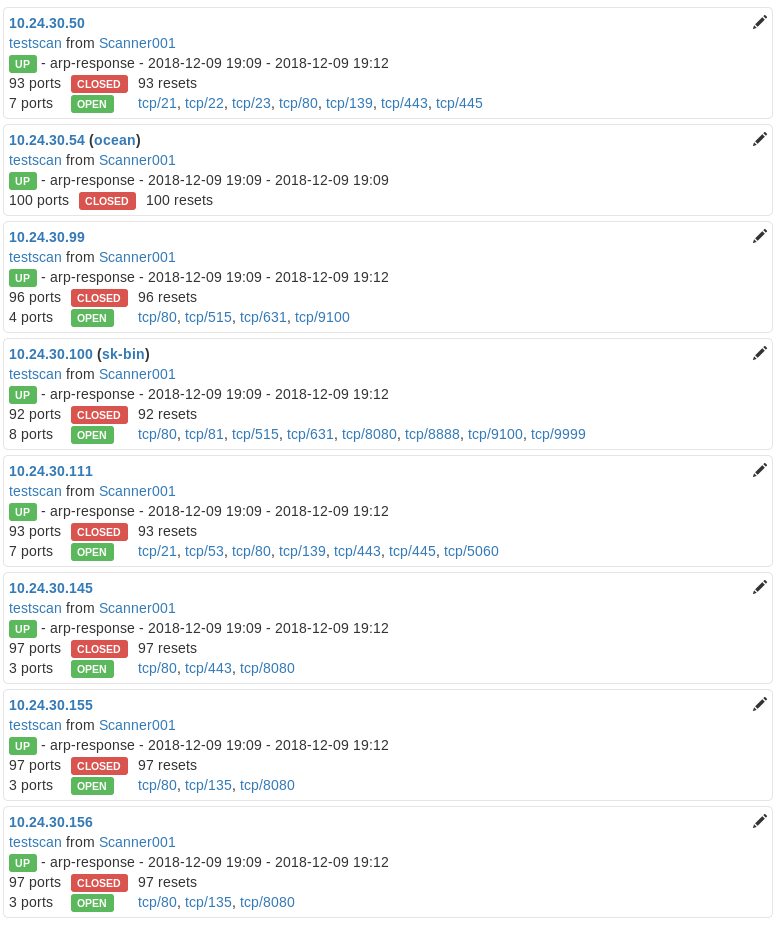
FILTER
The filter box is quick and easy to be used:
- TCP/22
- Will show only hosts listening on TCP/22
- 10.24.30.0/24
- Will show on only hosts in the defined subnet
- You can also enter specific addresses here to quickly find a single host
After having broken the results down to a single host, you will see something like this
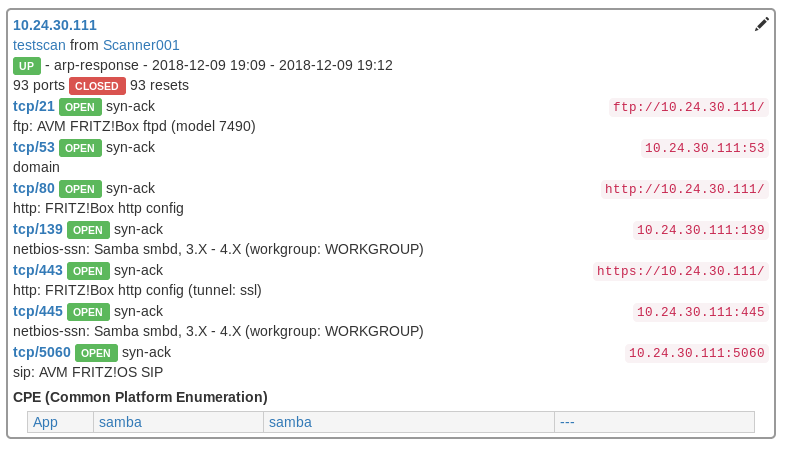
Filters can also be set by working with the results.
- Clicking on an octet of an IP address will add a filter for that network
- Clicking on a Port will add a filter for that port
- I suppose you can guess what happens if you click on a service name
- If you can’t: new filter!
Thus you can also set filters based on Common Platform Enumeration: Service names, authors, versions etc.
EXPLORE
The EXPLORE feature will generate various visualizations for you.
 |
 |
The first image shows the distribution of scanned IPs over the complete address space. As I only scanned the 10.24.30.0/24 network, there is only a single vertical line of dots. The second image shows the distribution of open ports over the complete address space currently being viewed and is great when looking for similar hosts. The list of hosts taken into account when generating the graph are dependent on the host list created by applying the filters. As such they can be easily optimized to show exactly what one needs to see.
|
|
The image on the left shows a count of hosts having the same open ports. The image on the right shows a count of identified services including their versions.
There also is a feature showing all scanned hosts on a world map, which for private IP addresses obviously doesn’t make a lot of sense!
Fun fact: The images are actually the ones created by IVRE. There is a simple download button for all of the graphs. The created images will be in svg format.
Notes & Documentation
As mentioned before IVRE contains a DokuWiki instance which contains the IVRE documentation but can also be used for making notes. Opening the pen symbol next to a scanned host will open the wiki in the right column.
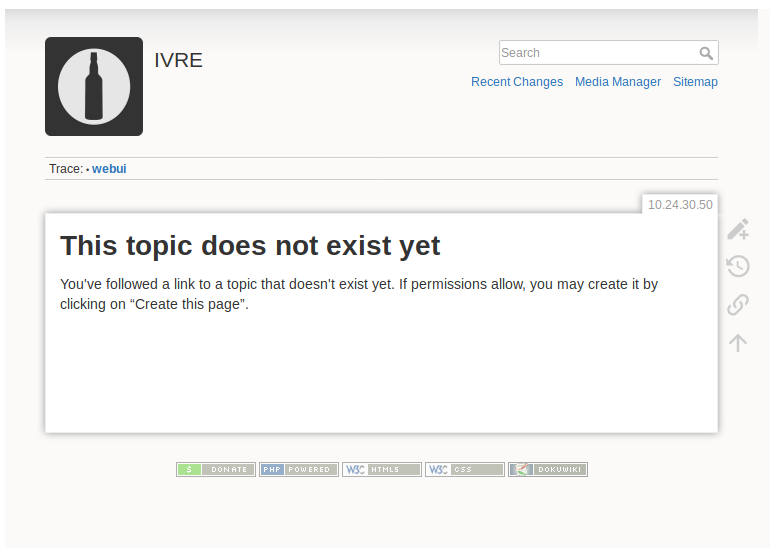
Being a full DokuWiki you can use wiki markup!
Main Menu
The main menu offers various predefined filters and functions like showing all identified webcams or SMB shares. When working with traffic captures (i.e. from bro) you can also quickly search for things like unencrypted traffic or credentials.
One very interesting option here is the Share menu. It allows you to create static reports to pass on to colleagues.
Verdict
When I started my recent scanning project and realized how big the bunch of data to analyze would be, I initially turned to Elastic Search and quickly found the Logstash module to work with Nmap. Turns out, the plugin does not work with the current version of Elastic and needs quite a lot of fixing. I tried and tried and then installed IVRE. So far I have not regretted my choice. IVRE does what it promises, is simple to install (using the provided docker images) and dead easy to use. It is also visually so good, that you can easily show your results in the UI to others who are not involved in your projects. For the future, I’m currently working on a larger project collecting data with bro and I will most surely give processing the results in IVRE a try and I guess it will also do the job there!
By the way, after posting about using IVRE and calling it “not quite perfect”, one of the devs replied and asked for feedback. Always a good sign!